Key Drivers and Challenges for New Energy Vehicles in the Current Market
- Nearly 22 million new energy vehicles sold globally in 2025, marking a 25% increase from the previous year.
- China leads with about two-thirds of total sales, while Europe and the US follow.
- Industry experts highlight legal hurdles, high prices, and infrastructure limitations as major barriers.
Key Takeaways
- Government policies and incentives, such as tax credits and infrastructure investments, play a crucial role in boosting electric vehicle adoption worldwide.
- Advances in battery technology lower costs and improve charging speed, making new energy vehicles more affordable and convenient for consumers.
- Challenges like limited charging infrastructure, supply chain issues, and high vehicle costs still slow widespread adoption but ongoing investments and collaborations offer promising solutions.
Key Drivers for New Energy Vehicles
Government Policies and Incentives
Government policies play a central role in shaping the adoption of new energy vehicles. Many countries use subsidies, tax credits, and infrastructure investments to encourage consumers and manufacturers. In the United States, the Clean Vehicle Tax Credit offers up to $7,500 off new electric vehicle purchases and $4,000 off used models. State and local incentives often stack with federal benefits, making electric vehicles more affordable. The government also invests in charging infrastructure, such as the $5 billion National Electric Vehicle Infrastructure project, which boosts consumer confidence by improving access to charging stations. Emission standards require automakers to increase the share of electric vehicles in their fleets, further driving adoption.
A comparison of government measures and their impact across major markets highlights the importance of policy support:
| Market | Government Measures | Impact on EV Adoption | Additional Notes |
|---|---|---|---|
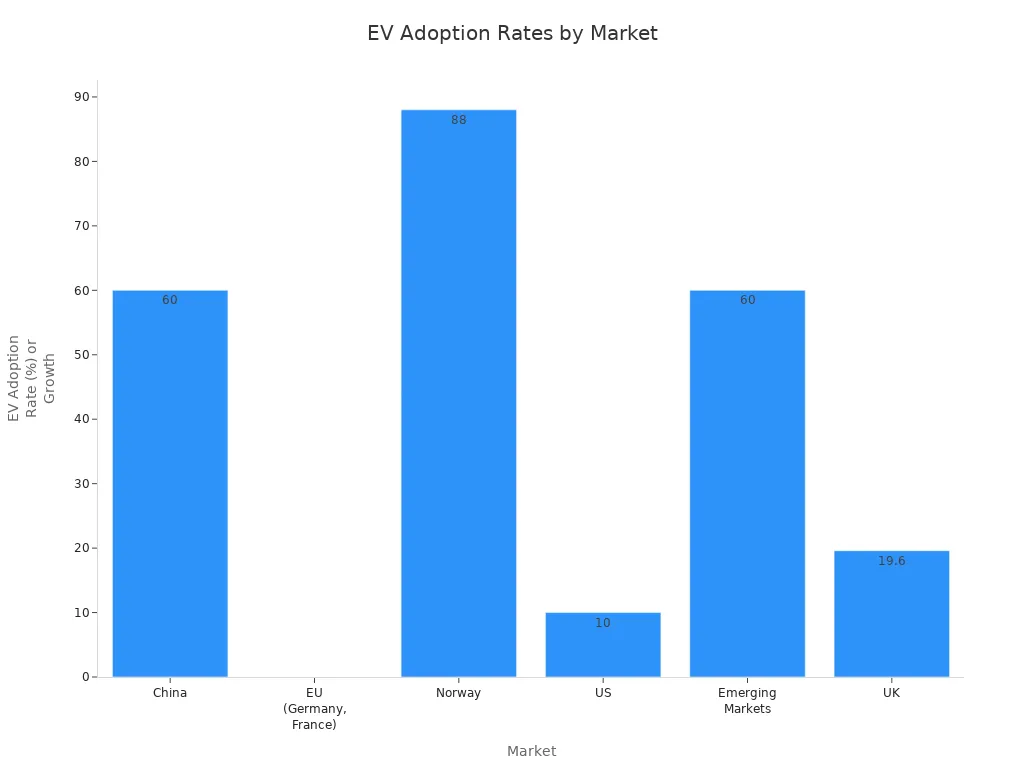
| China | Subsidies, trade-in schemes with higher EV discounts | Over 6 million drivers benefited; 60% chose EVs | Affordable domestic EVs; trade-in discounts up to £2,000 for EVs vs £1,500 for petrol/diesel cars |
| EU (Germany, France) | Phased out or reduced subsidies; tax benefits for businesses | EV sales stagnated or declined in large markets | Germany cut €4,500 subsidy to zero in 2023; France limited subsidies for high-income buyers |
| Norway | Early and consistent incentives and mandatory policies | Near 100% EV new car sales expected by 2025 (88% in 2024) | Combination of tax breaks and infrastructure investment; long-term consistent policy approach |
| US | Clean Vehicle Tax Credit (up to $7,500), state incentives | EV market share reached 10% in 2024 | Policy uncertainty exists; federal and state incentives combined; infrastructure investments ongoing |
| Emerging Markets | Tax exemptions, subsidies, local manufacturing incentives | 60% growth in 2024; doubling market share | New local EV brands emerging; reduced VAT for OEMs manufacturing EVs locally |
| UK | Removal of subsidies for private cars; ZEV mandate rules | 19.6% new EV registrations in 2024; largest EV market in Europe | ZEV mandates enforce sales targets; incentives remain for business fleets |
Recent policy changes also shape the market. The EU increased tariffs on Chinese-built electric vehicles, aiming to protect domestic industries. These tariffs may encourage Chinese automakers to build factories in Europe, which could create jobs and reduce emissions from shipping. In the US, policy shifts have lowered the projected market share for battery electric vehicles by 2030. China continues to support new energy vehicles through subsidies and industrial policies, while Western countries focus on fostering innovation and infrastructure.
Advances in Battery Technology
Battery technology stands at the heart of progress for new energy vehicles. Recent years have seen steady improvements in energy density, charging speed, and cost. Manufacturers now use advanced materials like silicon anodes and graphene composites, which increase energy density without sacrificing stability. Fast-charging systems, such as 800V platforms, allow some vehicles to charge from 10% to 80% in under 20 minutes. Battery management systems have also improved, optimizing performance and safety.
| Advancement Aspect | Details |
|---|---|
| Battery Energy Density Growth | Increased steadily by 5-8% annually from 2015 to 2024, enhancing EV range and efficiency. |
| Fast Charging Example | Hyundai Ioniq 6 charges from 10% to 80% in 18 minutes using 800V ultra-fast charging. |
| Charging Infrastructure Power | Tesla Supercharger V4 delivers up to 350 kW, enabling faster charging for Tesla models. |
| High-Voltage System | Porsche Taycan's 800V system supports peak charge rates of 270 kW, improving charging speed. |
| Battery Material Innovations | Use of silicon anodes and graphene composites contributes to higher energy density and stability. |
| Future Potential | Solid-state batteries could potentially double current lithium-ion energy densities. |
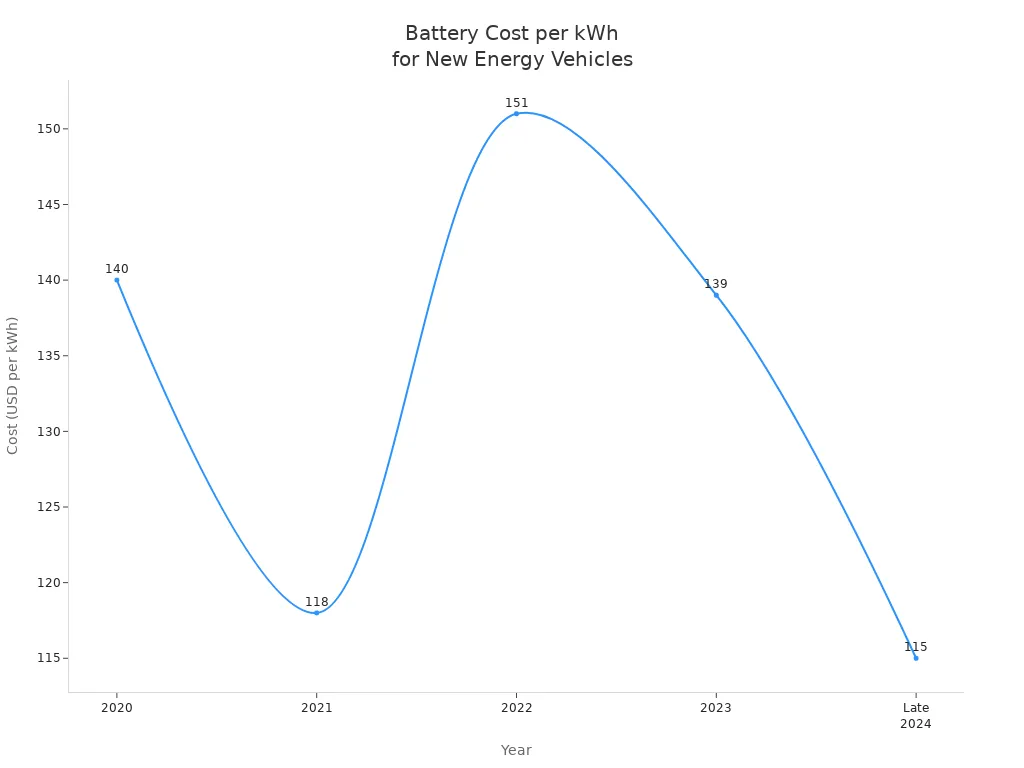
Battery costs have also dropped sharply. In late 2024, the average cost per kilowatt-hour fell to $115, a 20% decrease from the previous year. This decline results from overcapacity, lower raw material prices, and the adoption of cheaper lithium iron phosphate (LFP) batteries. Lower battery costs bring electric vehicles closer to price parity with gasoline cars, making them more accessible to a wider audience.
Shifting Consumer Demand
Consumer preferences continue to evolve as awareness of sustainability and cost savings grows. Many buyers choose new energy vehicles to save on fuel and reduce their environmental impact. In 2023, 76% of interested consumers cited fuel savings as a top reason for purchasing an electric vehicle, while 60% mentioned environmental concerns.
| Reason for Purchasing EVs | Percentage of Interested Consumers |
|---|---|
| Saving on fuel costs | 76% |
| Concern for the environment | 60% |
However, barriers remain. High costs, limited charging stations, and range anxiety deter many potential buyers. In 2023, 59% of consumers pointed to cost as a major barrier, while 56% worried about charging infrastructure. Hybrid vehicles have gained popularity as a transitional option, offering longer range and less dependency on charging.
| Barriers to Purchasing EVs | Percentage of Concerned Consumers |
|---|---|
| Cost | 59% |
| Lack of charging stations | 56% |
| Battery replacement cost | 55% |
| Range anxiety | 53% |
Consumer interest in sustainability also drives sales. Internet search trends show that increased attention to topics like "new energy vehicle battery" and "charging pile" correlates with higher sales volumes. Addressing consumer concerns and improving information access remain key to boosting adoption.
Investment and Industry Collaboration
Investment and collaboration fuel innovation in the new energy vehicle sector. Joint ventures and partnerships allow companies to share risks and pool resources for large-scale projects. For example, major green hydrogen facilities rely on partnerships between energy producers and technology firms. These collaborations secure financing, combine expertise, and accelerate the development of new technologies.
Partnerships reduce individual capital burdens and leverage each partner’s strengths, making it possible to scale up advanced technology and infrastructure quickly.
Industry alliances also help create integrated supply chains and support the rollout of charging networks. By working together, automakers, battery producers, and infrastructure providers can address challenges more effectively and bring new energy vehicles to market faster.
Major Challenges for New Energy Vehicles
Supply Chain and Material Constraints
Automakers face significant supply chain and material challenges in 2024. The production of new energy vehicles depends on a steady supply of critical raw materials. Several key materials remain in short supply:
- Rare Earth Elements, essential for electric motor magnets and advanced vehicle technologies.
- Copper, with supply limited by underinvestment in mining, leading manufacturers to use more aluminum in battery bus bars and charging cables.
- Aluminum, especially high-quality grades needed for propulsion components, faces deficits that recycling cannot fully address.
- Magnesium, with shortages caused by reduced smelting capacity in China due to environmental regulations.
- Nickel, manganese, and cobalt, with supplies affected by regional risks and environmental, social, and governance (ESG) concerns.
- Graphite, with recent shortfalls prompting efforts to localize supply chains.
Investment in mining and mineral extraction remains low because of ESG and financial risks. This limits the expansion of supply chains needed for mainstream adoption of new energy vehicles.
Tariffs on automotive parts disrupt global supply chains. These tariffs increase costs and delay shipments of critical components. Automakers must often find new suppliers or move production to avoid tariffs, which introduces inefficiencies and further delays. The battery-centric nature of electric vehicles adds complexity. Batteries require specialized handling and storage, and factories need expensive upgrades to support EV production. These factors lead to longer delivery times and higher prices for consumers. Geopolitical tensions and natural disasters also cause production suspensions, as seen when companies like Volvo and Tesla halted manufacturing due to conflicts in the Red Sea.
Charging Infrastructure Limitations
Charging infrastructure remains a major barrier to the widespread adoption of new energy vehicles. The ratio of public charging stations to vehicles varies by region. China leads with 12.82 million public connectors in 2024, supporting a 40.9% sales mix for new energy vehicles. This results in about one public connector for every three vehicles. Europe plans to add over one million new charging points by 2030, while North America currently has 204,000 public ports and plans for 30,000 more high-power connectors.
| Region | Public Charging Connectors / Stations | NEV Sales Mix or Market Penetration | Approximate Ratio (Public Connector : NEV) | Regulatory/Policy Context |
|---|---|---|---|---|
| China | 12.82 million public connectors (2024) | 40.9% NEV sales mix | ~1 public connector per 3 NEVs | National programs expanding highway service area chargers; mandates linking infrastructure to EV registrations |
| Europe | >1 million new charging points by 2030 | Rapid EV registration growth | High ratio implied, scaling with EV growth | EU mandates infrastructure quotas tied to EV registrations; policies to enhance interoperability and consumer confidence |
| North America | 204,000 public ports + 30,000 planned | Growing NEV market | Ratio improving with infrastructure expansion | Multi-brand charger retrofitting; cross-industry alliances linking charging to retail amenities |
Despite these efforts, consumers report several common complaints:
- High installation costs for chargers, especially DC fast chargers.
- Grid capacity constraints and the need for modernization.
- Geographic disparities, with rural and low-income areas underserved.
- Compatibility and standardization issues between EV models and chargers.
- Policy and regulatory inconsistencies slowing infrastructure deployment.
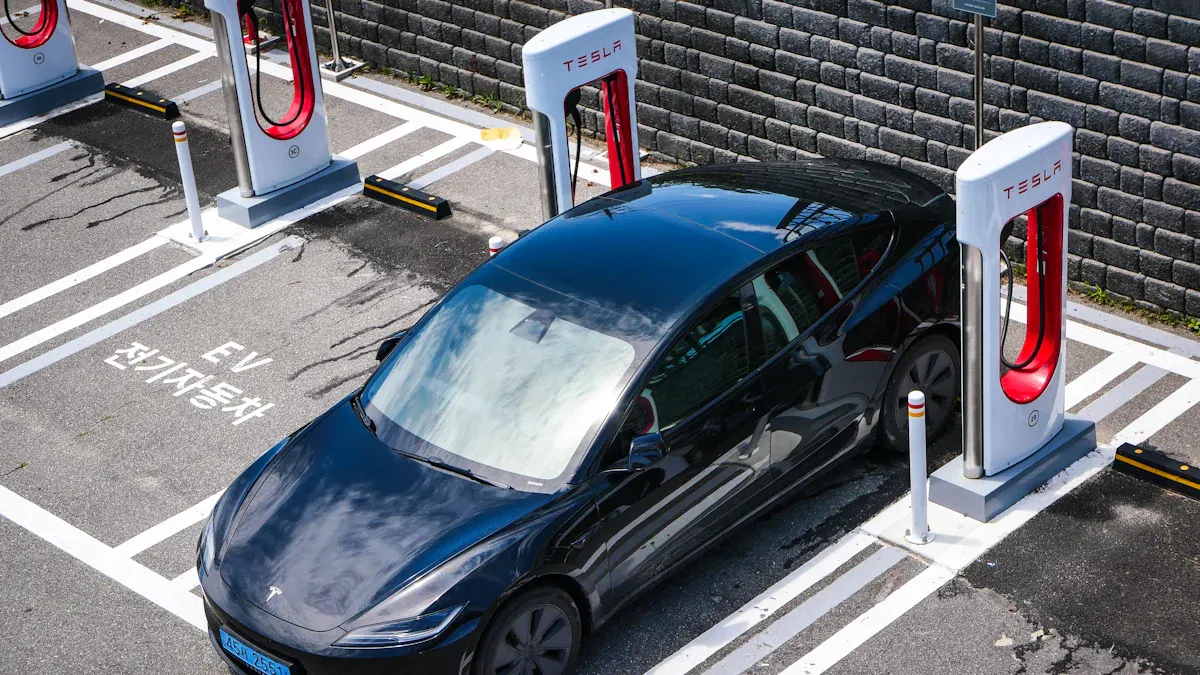
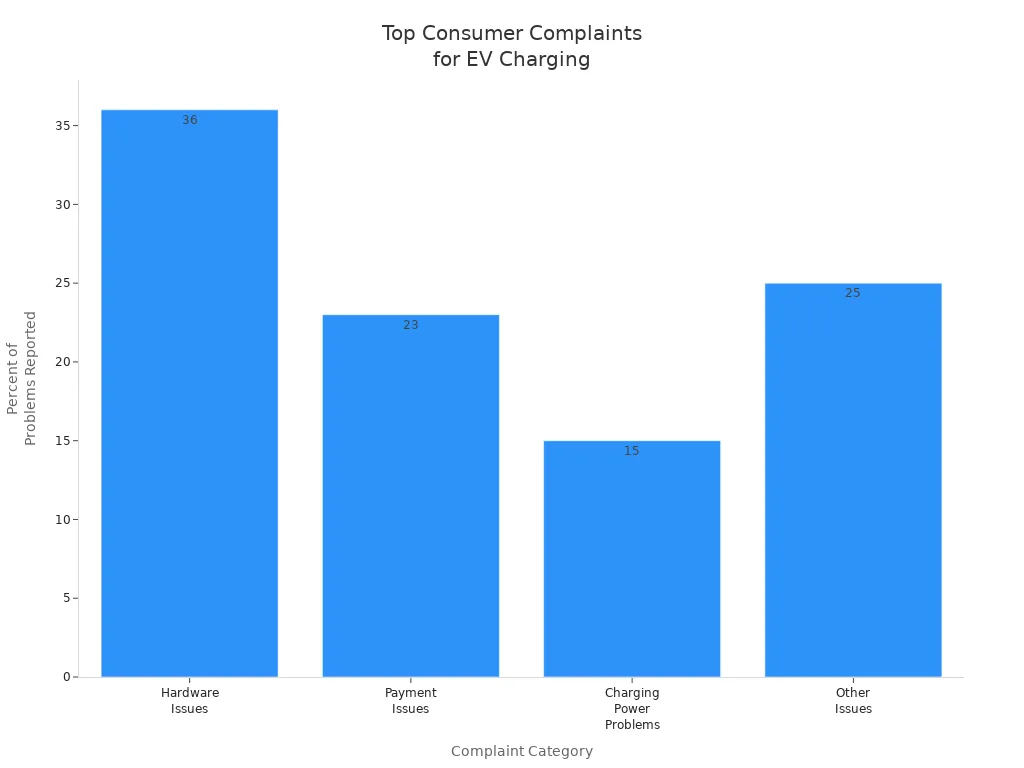
Hardware issues, such as broken or unresponsive screens, account for 36% of reported problems. Payment issues and charging power problems also frustrate users. Harvard Business School research found that public chargers in the U.S. have an average reliability of only 78%. This means about one in five chargers fail to work, which is worse than the reliability of gas pumps. Consumers also complain about erratic pricing and a lack of charging locations, especially in certain areas. These problems create "charge anxiety," a new concern for owners of new energy vehicles.
Policy and Regulatory Uncertainty
Policy and regulatory uncertainty presents another major challenge. Regulations differ across countries, creating a patchwork of standards for manufacturers. Tariffs, especially those resulting from US-China trade tensions, raise the cost of imported electric vehicles and components. For example, a 25% tariff can add thousands of dollars to the price of a vehicle. Volatile subsidies also destabilize demand and sales, making market conditions unpredictable.
Recent changes in the U.S., such as the potential rollback of climate policies and the scaling back of the Inflation Reduction Act, threaten to reduce tax incentives and support for electric vehicle adoption. This uncertainty complicates investment planning and compliance with emissions targets. In Europe, the suspension of incentives and trade-related tariff issues constrain growth. In China, the expiration of consumer incentives and the rise of domestic manufacturers create a challenging environment for foreign producers. These shifts force manufacturers to adjust production strategies and investment plans, making the regulatory landscape unpredictable.
| Aspect | China | Japan |
|---|---|---|
| Regulatory Approach | Strong government-led intervention with aggressive subsidies and local government competition | Industrial policy balancing emissions standards with automotive industry interests |
| Vehicle Purchase Restrictions | Major restrictions on ICE vehicle purchases in pilot cities | No major ICE purchase restrictions mentioned |
| Support Instruments | Subsidies, tax rebates for BEVs, PHEVs, FCEVs; local matching grants; command-and-control policies | Tax deductions, fixed-term subsidies, royalty-free patent licensing for EV technologies |
| Focus of Technology | BEVs and PHEVs prioritized; HEVs excluded from subsidies; mandates on foreign manufacturers to meet EV quotas | HEVs as transitional technology; investment in hydrogen fuel cell vehicles (FCVs) |
| Market Protectionism | Limits on foreign manufacturers; regional restrictions on vehicle purchase options | Emphasis on global collaboration and gradual technology transition |
| Battery Industry | Performance standards to consolidate battery manufacturers | Not specifically mentioned |
| Environmental Challenges | Heavy reliance on fossil fuels for power generation affects BEV environmental benefits | Similar dependency on fossil fuels; gradual emissions improvements through technology |
| Policy Evolution | Experimental governance with pilot cities scaling to national standards; subsidy phase-out planned | Long-term R&D strategy since 2001 focusing on FCVs; HEVs as a 'safe bet' during transition |
High Costs and Affordability Issues
The cost of new energy vehicles remains a significant barrier for many consumers. In 2024, the average price difference between new energy vehicles and comparable internal combustion engine vehicles dropped to $11,087. The average transaction price for a new electric vehicle reached $59,255. Incentives for electric vehicles declined by 14% to $6,886, but they remain more than double those available for gasoline vehicles.
Consumers have access to several financing options to improve affordability:
- Federal and state tax credits and rebates, though many are received after purchase and require upfront financing.
- Point-of-sale incentives, used in countries like Canada and the UK, reduce upfront costs.
- Equity-focused programs, such as California’s Clean Vehicle Rebate Project and Clean Cars 4 All, offer increased rebates for low-income buyers.
- Rebates for both new and used plug-in vehicles expand access.
- Innovative funding mechanisms like “feebates” charge fees on conventional vehicles to fund rebates for electric vehicles.
- The “Zero-Emission Assurance Project” provides battery replacement rebates for low-income buyers of used vehicles.
- Subsidies and mandates for charging infrastructure lower ownership costs.
- State programs, such as Oregon’s Charge Ahead rebate, offer additional incentives for low- and moderate-income households.
Despite these options, funding shortages and inequitable distribution of incentives remain challenges. Many programs favor higher-income buyers, highlighting the need for more sustainable and equitable financing mechanisms.
Market Competition and Fragmentation
The market for new energy vehicles has become highly competitive and fragmented. Many automakers, both established and new entrants, compete for market share. This intense competition drives innovation but also creates challenges. Companies must differentiate their products while managing costs and supply chain risks.
Fragmentation leads to a wide range of vehicle models, charging standards, and technologies. Consumers face confusion when choosing between different charging connectors, battery types, and software platforms. Automakers must invest in interoperability and standardization to improve the user experience. Market fragmentation also makes it harder for companies to achieve economies of scale, which can slow cost reductions and limit the reach of new energy vehicles.
New Energy Vehicles Market Outlook for 2025
Projected Growth and Sales Trends
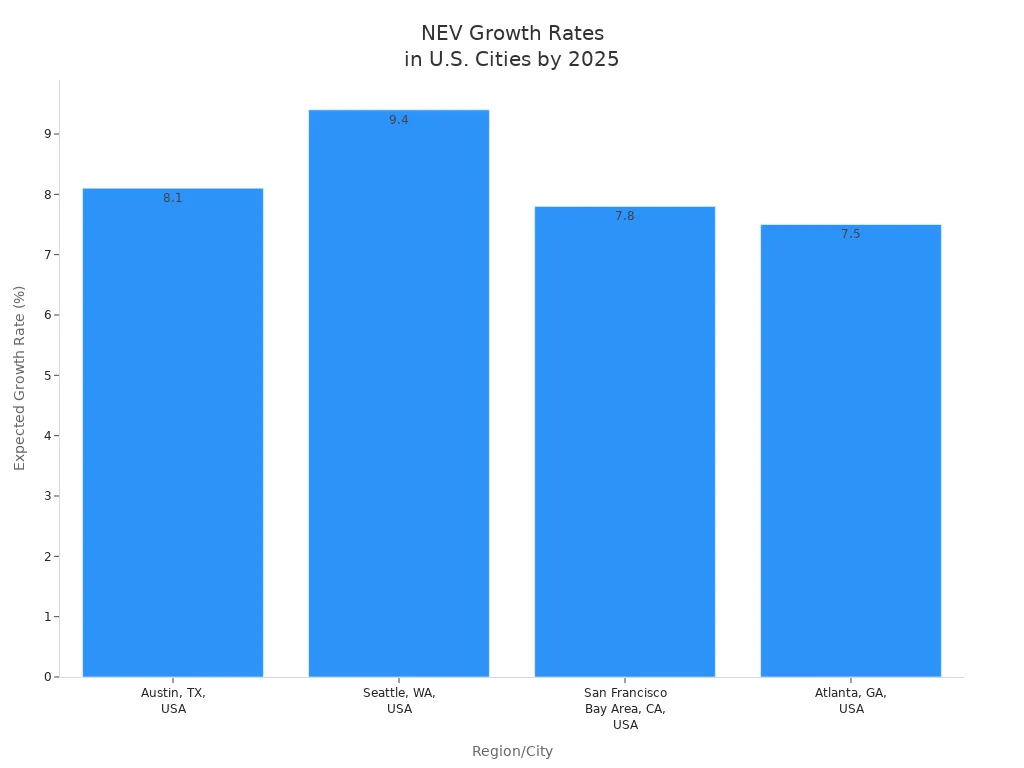
Benchmark Minerals forecasts a 28% increase in global sales for new energy vehicles in 2025. Analysts expect sales to surpass 20 million units, making up more than 25% of all car sales worldwide. In 2024, over 17 million electric vehicles sold globally, with emerging markets in Asia and Latin America showing the fastest growth. Electric car sales in these regions jumped by over 60% in 2024, reaching nearly 600,000 units. Urbanization and rising incomes drive this shift. Within the United States, cities such as Austin, Seattle, San Francisco Bay Area, and Atlanta lead in clean energy sector growth.
| Region/City | Expected Growth Rate (CAGR) | Notes |
|---|---|---|
| Emerging Markets | Not specified | Sales ratio shifts toward emerging markets due to rising incomes and urbanization |
| Austin, TX, USA | 8.1% | Fastest-growing U.S. city for tech startups and clean energy sectors |
| Seattle, WA, USA | ~9.4% | Strong growth in cloud computing and AI industries |
| San Francisco Bay Area | 7.8%+ | Hub for innovation and high-tech sectors |
| Atlanta, GA, USA | 7.5% | Growth in fintech, logistics, and health IT sectors |
Evolving Consumer Preferences
Consumers now prefer vehicles with longer driving ranges. Range anxiety remains a top concern, especially for cab drivers and those who travel long distances. Many buyers also look for smart features, such as intelligent driving and digital technology. These preferences push automakers to improve battery quality and add advanced features.
| Consumer Preference Aspect | Evidence Summary | Impact on NEV Market |
|---|---|---|
| Range Preference | Longer range preferred; range anxiety common | Drives battery improvements and market growth |
| Smart Feature Preference | Demand for AI and digital features rising | Helps differentiate NEVs from conventional vehicles |
| Policy Interaction | Range preference boosts policy effectiveness | Accelerates market growth and replacement of conventional vehicles |
| Market Dynamics | Low preference slows NEV adoption | Consumer acceptance is key for market evolution |
Research shows that early adopters are often middle-aged men in technical jobs, living in rural or suburban multi-person households. These buyers tend to be younger, better educated, and more environmentally aware than traditional car owners.
Opportunities and Risks Ahead
The next two years offer major opportunities for manufacturers and workers.
- Over 150,000 new jobs could emerge in the U.S. auto industry by 2030, with up to 125,000 in battery manufacturing and recycling.
- Expansion in commercial fleet electrification and heavy-duty vehicles presents new markets.
- Growth in charging infrastructure and advances in battery technology will support further adoption.
- Used electric vehicles will become more available, opening new segments.
However, several risks could slow growth:
- Tariffs on imports may raise costs and disrupt supply chains.
- Political and economic uncertainty in Europe and China could weaken demand.
- High vehicle prices and rising public charging costs may limit affordability.
- Intense price competition in China pressures profits and incentives.
BloombergNEF warns that rising public charging costs in the U.S. and Europe sometimes exceed gasoline prices per mile, which could deter buyers without home charging options.
- Technology improvements, policy mandates, and growing consumer interest drive rapid electric vehicle adoption.
- Automakers expand model choices and lower costs by advancing battery technology and supply chains.
- Experts predict strong sales growth, new business models, and continued innovation through 2025, supported by global investment and stricter emissions standards.
FAQ
What is a new energy vehicle (NEV)?
A new energy vehicle uses alternative energy sources, such as electricity or hydrogen, instead of gasoline or diesel. NEVs include electric, plug-in hybrid, and fuel cell vehicles.
Why do battery costs matter for electric vehicles?
Lower battery costs make electric vehicles more affordable. They also help manufacturers offer longer driving ranges and improve overall vehicle performance.
How does charging infrastructure affect NEV adoption?
Charging infrastructure gives drivers confidence to use electric vehicles daily. More charging stations reduce range anxiety and support wider adoption in cities and rural areas.